In response to the COVID-19 pandemic, governments aimed to curb epidemic outbreaks and transmission by restricting population movement through social distancing interventions and thus reducing contacts between individuals. But what can people’s movements tell us about COVID-19 transmission?
Mobility data represents an important proxy of contacts to track and predict COVID-19 transmission. In a study, published in Nature in January 2021, an Imperial London College research group led by Dr. Pierre Nouvellet of the Faculty of Medicine, School of Public Health, examined potential correlations between COVID-19 transmission and mobility. The results support one basic tenet of global COVID-19 related restrictions on human mobility: the more people move outside, the higher the chances of meeting someone potentially infected (and vice versa). However, the more nuanced insights of this study complicate our understanding of transmission of the virus.
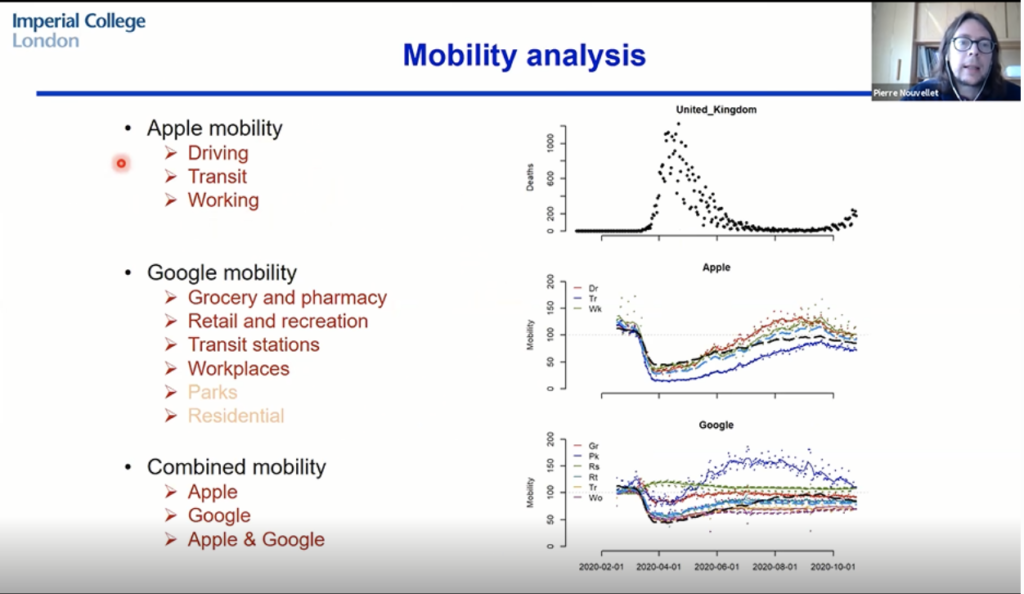
Virtual databases from big data providers constitute ideal sources of information for this kind of research, making the largest amount of standardised mobility data accessible to scientists. With this in mind, the researchers combined mobility data from Google and Apple which, according to Nouvellet, provide the best proxy for contact rates during the pandemic. Another key consideration for the choice of such mobility databases lies in the fact that they “ provide estimates pretty much in real time, which make it very useful if you would want to make forecasts” said Nouvellet in an interview following his February MOOD Science Webinar presentation.
Apple mobility datasets collect information on the nature of mobility such as driving and transit (public transport) on a daily basis, whereas Google provides major details on the location of mobility.
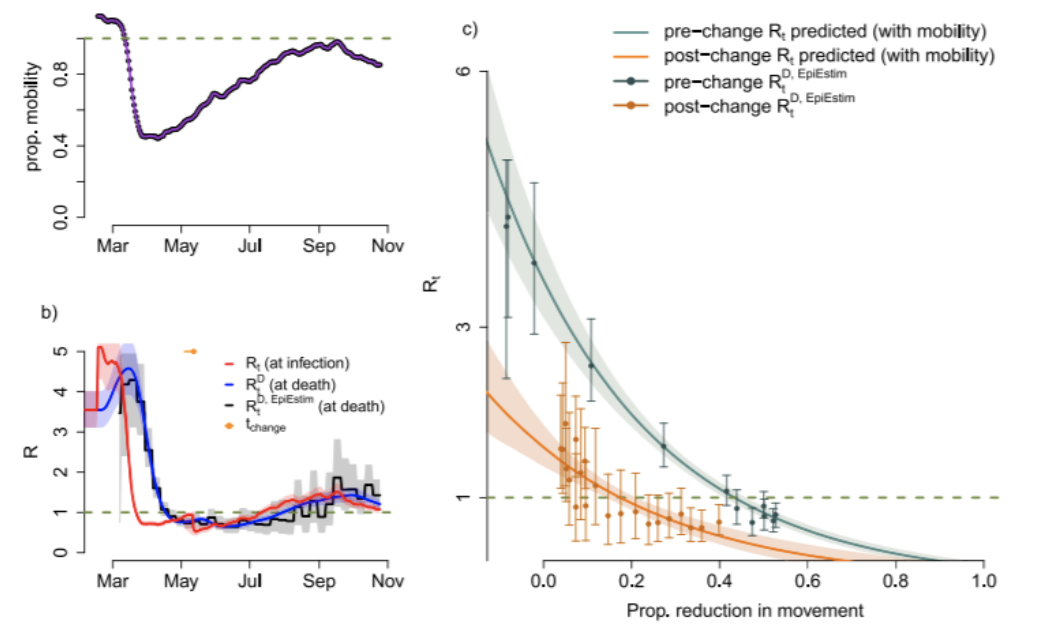
The researchers developed an estimate of COVID-19 transmissions starting based on the reported number of new deaths (D), a parameter of infection more reliable than the reported cases, and the the reproduction number (Rt) – the average number of cases generated by one single affected person – for each country and in each point in time. Afterwards, they linked Rt to the change in mobility trends across time, analysing the correlation among these two variables (parametric estimates).
The model of COVID-19 transmissions in each country and in each point in time is based on two parameters: transmissibility when the mobility was unaffected and the function representing reduction in mobility.
The resulting R-mobility correlation was in turn compared with estimated changes in COVID-19 transmission (Rt) not linked to mobility (non-parametric estimate), as a baseline to validate the parametric framework adopted by the Imperial College London team.
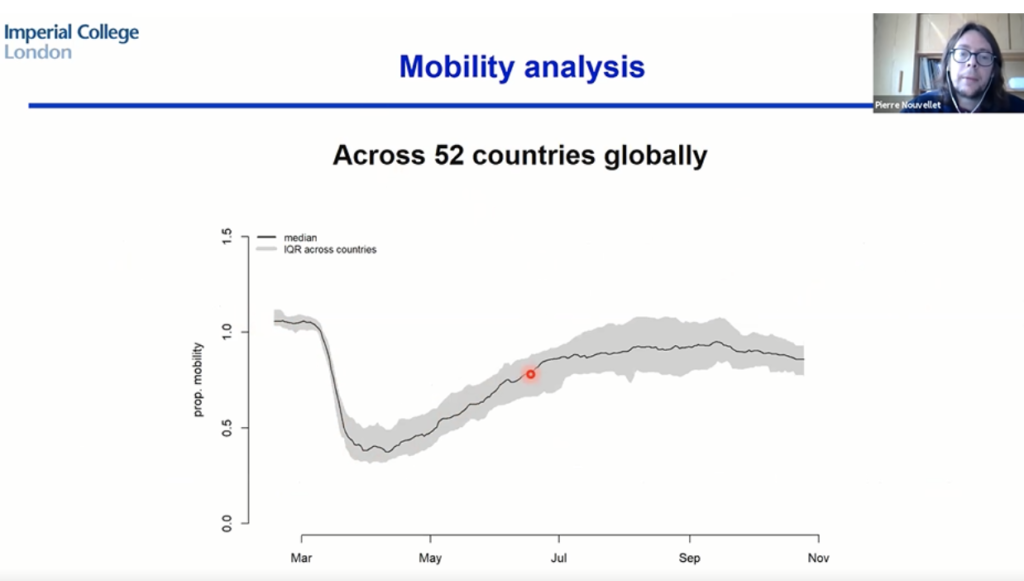
The first results were obtained in May 2020, after the first wave of the pandemic. Observing the trends of both COVID-19 transmissibility estimates and mobility ( as proportional reduction in movement compared to pre-pandemic times) in the United Kingdom, the team found a striking correlation between the two: as mobility decreased gradually over time, so did the transmission of COVID-19, underscoring the mitigating effect of redureducing contacts between people.
However, by the time the study was published in January 2021, new models were run resulting in unexpected trends between mobility and COVID-19 transmissions. The team found evidence of a decoupling between the two estimates following the relaxation of strict control measures for 80% of countries during the second wave, starting from May 2020. From this month onward, movement saw a gradual increase, but COVID-19 transmissions surged to a lesser extent than the researchers had expected suggesting that the relationship between mobility and transmission can change or fluctuate.
This trend applied to the majority of countries in Europe, the Afro-Eastern Mediterranean region, the Americas as well as South-East Asia and the Pacific, for all of which data indicated a weaker and more varied relationship between mobility and epidemic transmission during the second wave. Overall, the reliability of the relationship varied between countries.
What is the necessary reduction in mobility to achieve control over COVID-19 transmission?
To achieve the goal of increasing mobility without increasing transmission, the research also sought to define an estimate for the “mobility threshold”, in other words, what it takes in terms of mobility reduction to make sure that one person infected with COVID-19 transmits the virus to fewer than one person ( Rt below 1).
During the first wave in the United Kingdom, “it was necessary to reduce mobility by 40% to get the epidemic under control” while “during the second wave, we could afford to reduce mobility by only about 20%”, according to Nouvellet.
Similar patterns were found for the majority of countries surveyed, which again suggests a significant difference in mobility thresholds for the first and second wave respectively.
So is mobility a sufficient parameter to track and predict COVID-19 mobility for better decision-making?
The study shows that at the beginning of the pandemic, estimates of mobility may account for roughly 75% of variation in COVID-19 transmissions. But after the second wave, the correlation weakened and at this stage mobility explain only about 30% of variation in transmission .“This shows that there is an important factor at play : social distancing” said Nouvellet. “The analysis didn’t look also at interventions such as testing and tracing, isolating [COVID-19] cases, and now vaccination. So, in a way, mobility, and probably more importantly, social distancing, is not the only story in terms of transmission dynamics of SARS-CoV-2”.
Decisions on mobility restrictions should therefore also be made made in consideration of the effects of each specific intervention in place ( social distancing, cases isolation, fast tracking and vaccination), in addition to changes in population mobility.
Despite continuous publications casting light on novel aspects of SARS-CoV-2 epidemiological patterns, this study’s insights on the limited correlation between mobility and COVID-19 transmission curves spell further uncertainty about the how’s, why’s and where’s of virus transmissions.
In Nouvellet’s view, future research is needed to incorporate a more comprehensive and detailed approach to locate disease transmission (for example, whether it occurs indoors or outdoors) in order to build optimised predictive models about the locations of infection occurrences. In addition, measures that would better characterise contact rates such as changes in mobility behaviours and proximity between countries are needed to explain, predict and trace COVID-19 transmission.
The information in this article is based on Pierre Nouvellet’s presentation as part of the MOOD project’s monthly Science Webinar series and on the ensuing interview with Alexander Wowra.
Editorial work by Valentina Delconte and Alexander Wowra.