Commissioned by the MOOD project to provide a visual analytics platform, the Montpellier Laboratory of Computer Science, Robotics and Microelectronics (LIRMM) developed the ‘COVID-19 DataExplorer Map’, an innovative tool that provides (nearly) live information on the epidemic in combination with mobility data to explore (un)expected patterns and correlations.
The team behind the platform is comprised of professor Pascal Poncelet, Advanse (ADVanced Analytics for data SciencE) team founder and specialist in data mining, machine learning and visualization at the University of Montpellier; Laetitia Viau, a first-year PhD candidate specializing on visualization of spatiotemporal data and their application to epidemiology; Nancy Rodriguez, assistant professor, working in interaction and virtual reality at LIRMM and University of Montpellier; Pierre Pompidor assistant professor in computer science, specialist in visualization at LIRMM and at the University of Montpellier; and Arnaud Sallaberry, assistant professor in computer science, specialist in information visualization and visual analytics at LIRMM and at the Paul-Valéry Université of Montpellier.
The need for common ground
The outbreak of COVID-19 pandemic, preceded in the 21st century by other severe and transmissible zoonotic epidemics, led the international community to acknowledge that “the health of humans, animals and ecosystems are interconnected” (1), depicting human health as a complex, transboundary, multifactorial, and across-species.
2020 has also shown us that open and fast data sharing platforms have become vital tools to respond to global health risks (2), and enormous raw data collections might deepen the gap between scientists (those producing data and forecasts) and decision makers (those designing responses and resource reallocations), hindering communication and epidemics surveillance (3).
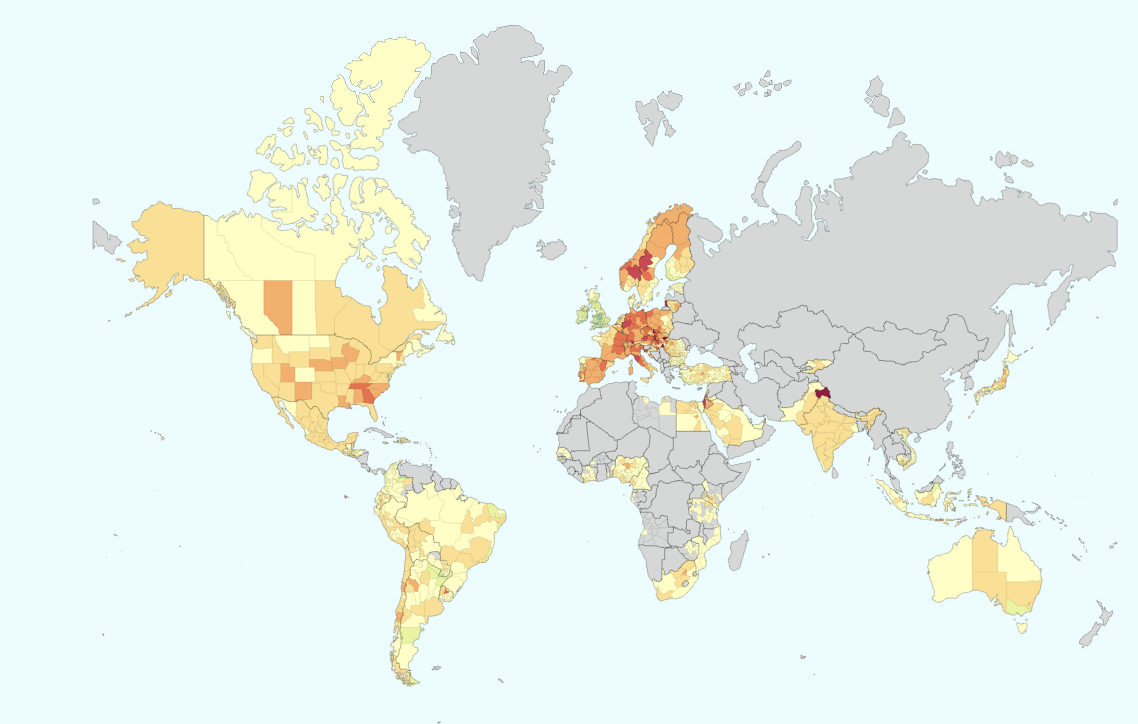
COVID-19 DataExplorer map
The map tool seeks to enable researchers and health authorities to compare easily many different parameters stemming from different datasets over time.
This way, it helps to make big datasets more approachable and accessible for more cost-effective and time-saving analysis.

Thanks to multiple datasets, different parameters can easily be seen and compared, following the evolution in space (on the map) and time (along the time slider) of the outbreak. On the vertical side, a gradient of colors indicates the value of the selected parameter, making the dataset easy to visualize and interpretations more intuitive for effective consultations.
The platform presents a visualization of extensive epidemiological datasets – currently sourced from “Our World in Data” and “Google Mobility data.” Another dataset (Oxford Covid-19 Government Response Tracker) concerning the different types of lockdown around the world will also be made available soon. The developers are planning to further expand the options by allowing users to add open source datasets more easily in the future via python code and thus turn the tool into a full-scale open data platform.
“Our World in Data” is retrieved from the daily collection of the COVID-19 data maintained on the Our World in Data website. It includes data on confirmed cases, deaths, hospitalizations, testing, and vaccinations as well as other parameters of interest, giving the opportunity to overlay multidisciplinary datasets.
The second database currently available is ‘Google Mobility’ which charts movement trends over time across different places such as retail and recreation, groceries and pharmacies, parks, transit stations, workplaces, and residential areas.
Teaming up for the future
With the availability of multifactorial and up-to-date datasets in combination with an interactive visualization tool, COVID-19 Data Explorer Map will allow users to explore multiple datasets in a time-efficient manner. The tool will also enable decision-makers to rapidly understand COVID-19 trends, bridging data gaps and to effectively translate epidemiological analysis into a set of decisions and actions to limit the spread of the pandemic, such as vaccination campaigns and mobility restrictions.
The work of the LIRMM scientists reflects the rise of cross-disciplinary collaborations to curb infections outbreaks, in which governments, researchers, institutions, and companies across sectors at the local, national, regional, and global levels implement joint responses to one of the major health threats of our times.
The COVID-19 Data Explorer Map platform is now accessible from the official project website.
Author and editorial work: Valentina Delconte
All information provided from interview by Alexander Wowra with Pascal Poncelet, Laetitia Viau, Nancy Rodriguez, Pierre Pompidor, and Arnaud Sallaberry
References
- Acharya, K. P., Subramanya, S. H., & Neupane, D. (2021). Emerging pandemics: Lesson for one health approach. Veterinary Medicine and Science, 7(1), 273.
- Xu, B., & Kraemer, M. U. (2020). Open access epidemiological data from the COVID-19 outbreak. https://www.thelancet.com/journals/laninf/article/PIIS1473-3099(20)30119-5/fulltext
- How decision makers can use quantitative approaches to guide outbreak responses – opinion piece, Morgan,2019, The Royal Society Publishing.
- Mackenzie, J. S., & Jeggo, M. (2019). The One Health approach—Why is it so important?, Trop Med Infect Dis. 2019 Jun; 4(2): 88.