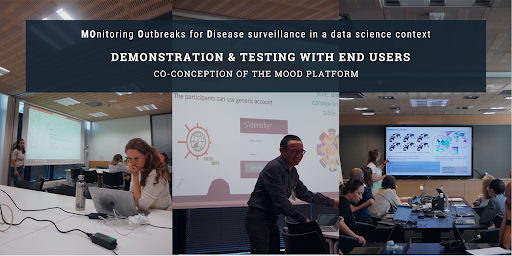
Report on the demonstration and testing sessions with potential end users
On June 28th 2023, the MOOD project partners hosted plenary demonstrations of the modules, tools and services of the soon to be released MOOD platform to potential end users/ EI practitioners. Some of these modules are generic, and some are specific to emerig infectious diseases, EID (vector-borne diseases, VBD; Highly pathogenic avian nfluenza) and including antimicrobial resistance, AMR (under development, results not presented). They were followed by Interaction sessions where all participants tested the different tools, modules and services and, discussed useful improvements and answered a short survey on each session.
Disclaimer: The list of MOOD tools is not exhaustive. The ones related to AMR, ZIK and CHIK will be available in 2024.
1. Participants in the testing sessions
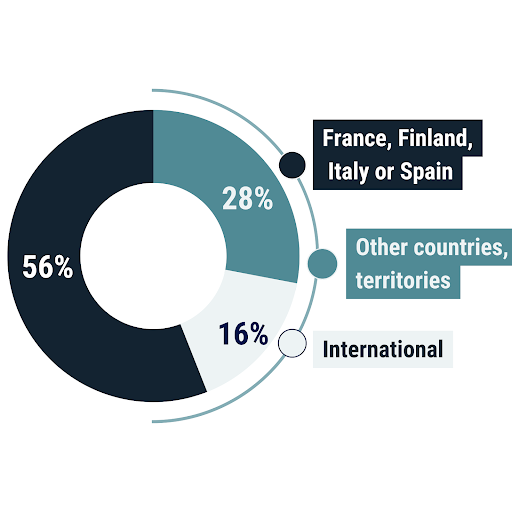
Out of 57 respondents to our questionnaire, 32 (56%) were from France, Finland, Italy or Spain (MOOD partner countries), 16 (28%) were PH/AH representatives from other countries or territories. In addition, 6 respondents were working for international agencies.
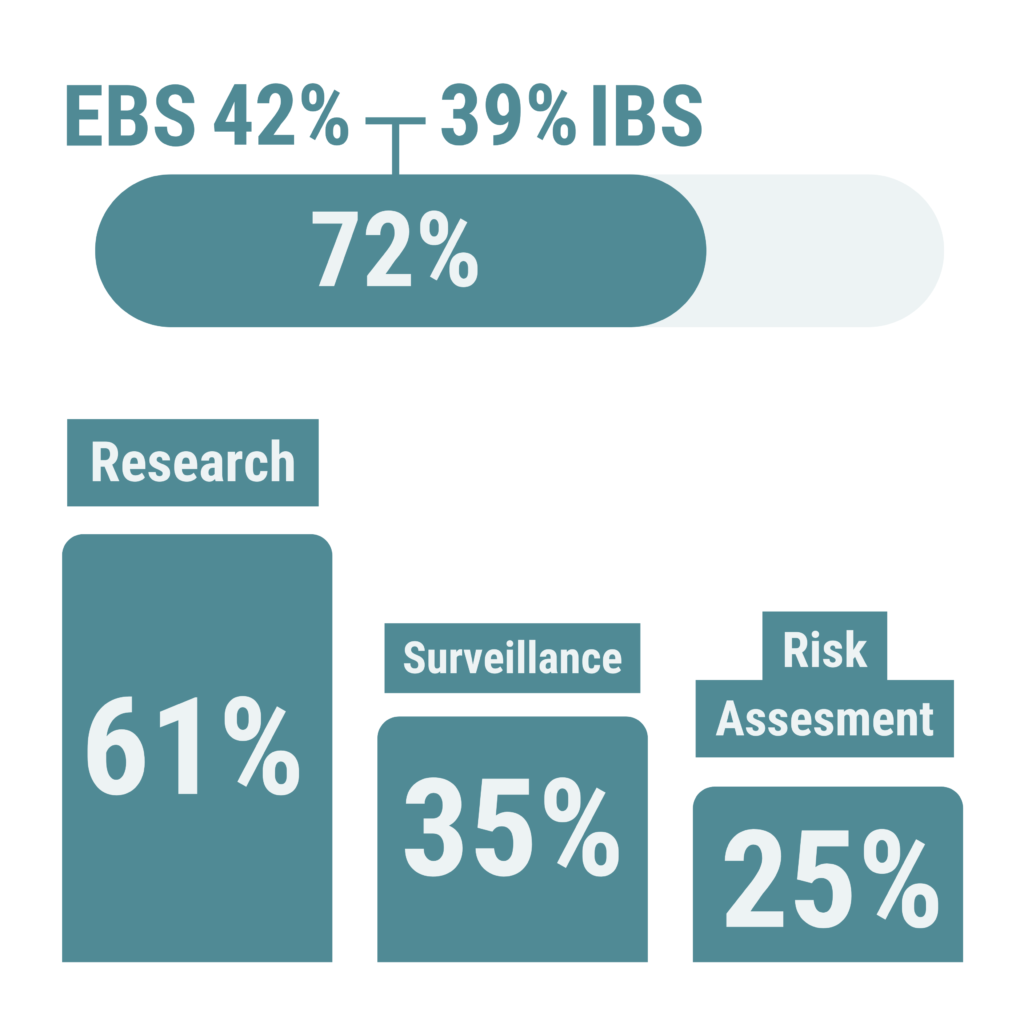
41 (72%) respondents had Epidemic Intelligence activities, with Event-based surveillance (EBS) activities slightly more represented than Indicator-based surveillance (IBS) (implemented by respectively 42% and 39% of the respondents).
The main areas of expertise of respondents were: Research for 61%; Surveillance for 35%; and Risk assessment for 25%.
2. MOOD Platform Generic Modules
2.1 Data & Covariates Access Module
2.1.1 Purpose: access to covariates for climate, environment, hosts, vectors in Europe

The “Data & covariates access” module will be a one-stop “shop” for the visualisation and download of relevant standardised covariates used for modeling and risk assessment of infectious diseases.
2.1.2 Feedback on the Data & Covariates Access Module

Out of 23 respondents, 65% found the module useful for visualisation, exploration, understanding of disease risk by easily accessing pre-processed spatio-temporal data and saving time for epidemiological analysis, time series analysis, modelling.
Some respondents (39%) encountered difficulties with the tool. Some were due to a lack of metadata, and the impossibility to display some rasters (previously uploaded) due to the reduced visibility when using a large geographical extent.
Half of respondents expressed the need for additional functionalities that would be useful for their work: other relevant environmental and vector/host species data, buffering around points, possibility to measure distance between points, improved metadata, different resolution settings and larger geographic coverage.
2.1.3 Next steps

MOOD developers will work on improving the ergonomy of the platform, offer other basemaps and new layers (with a more complete list of vectors for TBE, WNV, CCHF, DEN/CHIK/ZIK), have wider options for export of maps and data, including time series data, improve guidance for users (metadata and help guide), as well as enlarge the geographical extent of the module. New long term and time sliced outputs for temperature and vegetation derived from the VIIRS satellite imagery and for precipitation from the climate data store will be added, and annual temperature based seasonality for TBE vectors regularly updated.

(1) New features such as a link to the covariates layers metadata, extraction of time series value based on feature attribute will be added before the end of December 2023. (2) Also in December, a training and internal tests with partners will be organised. (3) A training and further consultation of potential end users will be organised during spring 2024.
2.2 Epidemic Intelligence Data and Visualisation Module: Epid-Data Explorer (EDE)
2.2.1 Purpose: visualisation

Epid-Data-Explorer (EDE) allows users to perform cross-regional and cross-temporal analyses of epidemiological data, as well as covariate data (e.g. weather data), through the MOOD platform or on a local server (on a personal computer, possibly with personal data).
The platform offers a range of capabilities such as: to view data at different levels of temporal resolution, zoom in on specific regions for closer inspection, compare the behaviour of a particular region with the entire dataset, download selected data, and compare two indicators from different datasets on the same interface.
2.2.2 Feedback from the participants on Epid-Data Explorer (EDE)

Out of 28 respondents, half of them found the EDE tool useful for exploratory analysis of drivers of trends / risks and comparison between countries.
However, most users (75%) encountered difficulties with the tool, mainly linked to installation of the standalone version and integration of their own data.
35% (n=10) of participants expressed the need for additional functionalities, such as: adapting choices of colour scales, additional data formats, raster (covariates for instance) with the outbreaks locations (latitude/longitude), more data sources and dot or spot map presentation.
2.2.3 Next steps

(1) The installation of the module will be simplified by integrating it into the MOOD platform, ensuring the performance along with data security. The preliminary architecture will be available by the end of 2023. (2) The current phase focuses on refining input data, enhancing user data protection, and improving visualisation elements like color choices based on granularity. (3) A presentation of EDE integrated into the MOOD platform will be given at the final General Assembly in 2024.
2.3 Epidemic Intelligence Data and Visualisation Module: PADI-web
2.3.1 Purpose: Media monitoring

PADI-web automatically collects news articles from Google News with custom queries, classifies them and extracts epidemiological information (diseases, dates, symptoms, hosts and locations).
2.3.2 Feedback from participants on PADI-web


Out of 28 respondents, 64% found the PADI-web tool useful for screening media and extracting information with tailored settings, for conducting a quick literature search for research, surveillance, early warning and preparedness activities.
Some participants (36%) encountered some difficulties while testing the tool. They suggested improvement of visual analytics, better and/or easier classifications and precisions in terms of outputs.
32% (n=9) of participants expressed the need for additional functionalities such as a more interactive interface, add contextual information to each of the signals/events detected, the possibility to group and/or select several signals into one event, provide the option to read the text from the news item in another window, and clarify names of PADI-web functions and some human-machine interface presentations.
2.3.3 Next steps
MOOD developers will improve some functionalities following feedback of MOOD workshops including the implementation of new outputs (i.e. new format, new spatial normalisation, etc.) to be compliant with other tools of MOOD, the development and implementation of new algorithms (detection of signals (2023) and of signal duplication (2024)) and quality labels related to the article sources collected (2023).

(1) Based on a specification document co-written between developers and end-users a new version of PADI-web will be provided with some improvements (e.g. optimization of PADI-web database, adding standardised outputs, map and automatic country detection strategy improvements, improvement of notification emails and human-machine interface presentations, etc.) in November 2023. (2) A training and further consultation of potential end users from public, animal and plant agencies will be organised in October 2023 in Mauritius (Indian Ocean case study) and Reunion island.
3. MOOD Platform Disease Specific Module: Disease Risk Mapping
The Disease Risk Mapping Module provides risk maps and other modelled outputs, aiming at highlighting areas suitable for the occurrence of (mainly) specific zoonoses in animals and humans, to support improved disease detection, monitoring and surveillance.
3.1 West Nile Virus (WNV), Tick Borne Encephalitis (TBE)
3.1.1 Risk mapping of TBE and WNV
For TBE, MOOD researchers presented annual static maps showing the probability of occurrence of human TBE cases at NUTS3 and municipal level, as well as maps highlighting the appearance and disappearance of new risk areas with respect to the previous year. These maps will be available on the MOOD platform.
They also presented research work on TBE drivers (literature review and dashboard) and investigation of ecological drivers of TBEV at the Palearctic scale using phylogeographic and niche modelling approaches that will lead to static maps of sequences until 2022, with code made available to end users.
Regarding ticks and other tick borne pathogens, MOOD team presented activities that are at different stages: a proof of concept of a tool that would recognize tick species from photographs taken by citizens, research work on drivers of pathogen prevalence that will lead to guidelines for end users, as well as ongoing work on seasonality indicator in order to produce suitability masks to be made available to end users of the covariate module.
As far as WNV is concerned, MOOD researchers presented published work on the contribution of climate change to its emergence in Europe and on the quantification of WNV force of human infection that will remain a scientific contribution.
3.1.2 Feedback from the participants
Participants raised questions on the data used for modelling and the climatic variables that were considered as drivers. They also had questions on risk thresholds in modelling, whether a model could be made available for PH agencies to identify new locations at risk, as well as on potential functionalities of participatory apps, i.e. : get information on users participating to data collection, the efficiency of identification (including how to differ stages) ad well as the possibility for users to report tick bites on animals.
3.1.3 Next steps
- Integration of TBE risk maps to the MOOD platform
- Production of guidelines on drivers of pathogen prevalence
- Pursue the development of seasonal indicators mapping for integration to the covariate module
- Finalisation of other research activities
3.2 Dengue
3.2.1 Purpose of the tool: predictive risk mapping

The web interface (R-Shiny application) aims to support decision-making for surveillance and control of DEN, CHIK and ZIK in Europe through a predictive mapping of vector density (Aedes).
3.2.2 Feedback from participants
The participants have tested the tool during the session. They have raised recommendations to improve the ergonomics of the interface. In terms of development, the model’s parameters and functionalities were discussed. Users raised the need to take into account different vector control strategies, the possibility of using their own datasets and the need to take into account socio-economic parameters in order to weight exposure.
The use and relevance of the model in various epidemic scenarios (international sporting events in particular) was also discussed. The date of availability of the tool was also a concern.
3.2.3 Next steps
- Continue the development of the tool including the implementation of control strategies and the possibility to use personal data as input;
- Promote and peer review the work through scientific publication(s);
- Meeting with the french Vectors WG (ANSES) in september 2023. The practical objectives, the structure and parameters of the model were discussed, as well as the need of validation based on past outbreaks and the possibility of implementing additional features such as the co-existence of multiple vectors;
- Organise a workshop with potential end-users, national contact points for Aedes borne diseases from Croatia, France, Spain, Portugal, Italy and Greece in early 2024
3.3 Highly Pathogenic Avian Influenza (HPAI)
3.3.1 Risk mapping of HPAI: several tools for several EI and risk assessment purposes

A list of covariates has been extracted from literature search for Influenza A, including environment, animals, and humans related covariates. There are different endpoints considered (outbreaks, % of positives, persistence in the matrices, infection rates in %), requesting a standardisation.
A wide range of covariates layers related to HPAI, including climatic, environmental and bird distribution will be available.
An algorithm will be available for an unsupervised EBS using an EpiDCA model. It has been applied to Avian Influenza in South East Asia region but it allows a generic approach (applicable to different diseases and environmental contexts). The evaluation framework comparing PADI-web (automated system), ProMED (moderated system) and Empres-i (ground-truth) on Avian Influenza animal cases from 2019 to 2021 showed that PROMED covers more countries, while PADI-web is more timely (Although ProMED better captures periodic events), and Both systems rely mostly on different sources + PADI-web relies on more timely important news outlets.
A database of standardised records from EMPRES-i and GenBank will be available on the MOOD platform.
Static maps, analytical framework (commented codes), and manuscripts will be based on 1) mapping conversions of HPAI (mutations leading to LPAI to HPAI), 2) Risk mapping / Clustering of the probability of the disease occurrence among wild birds based on climatic data and vegetation indexes (ecology of migratory birds) at the MOOD extent and 3) Risk mapping / Clustering of the probability of the disease occurrence among poultry birds based on proxys for poultry intensification, human and poultry density, among others. Several modelling approaches were used including GLM (Generalised linear models), INLA, BRT (boosted regression trees), etc.
3.3.2 Feedback from participants
Participants raised questions on three themes: (1) the validity and robustness of the outputs, their added-value and type of use in Padi-Web, (2) the development of an algorithm that could be used to update the list of covariates, their validation, and separation for influenza A and HPAI, (3) on the possible use of additional bird layers and on the ground source for HPAI modelling.
3.3.3 Next Steps
- Standardisation for measurement and analyses of covariates and their impacts;
- Integration of HPAI risk maps to the MOOD platform.Continue the development of the tool. Meetings with AVIA-GIS are planned to work on disease-specific MOOD platform. Meeting to be scheduled by the end of 2023.
- Ongoing production of analytical framework guides (codes).
- Ongoing writing and publishing manuscripts
- Finalisation of other research activities
- Meetings with OAI to get continuous access to database (July 2023)
Conclusion: next milestones in brief
- Covariates module: A workshop and further consultation of potential end users will be organised during spring 2024.
- EDE: A presentation of EDE integrated into the MOOD platform will be given at the final General Assembly in 2024.
- PADI-web: a new version of PADI-web will be provided in November 2023
- Integration of TBE risk maps to the MOOD platform in February 2024
- DEN: a workshop with potential end-users, national contact points for Aedes borne diseases from Croatia, France, Spain, Portugal, Italy and Greece in early 2024
- Integration of HPAI risk maps to the MOOD platform in June 2024
- Integration of WNV risk map (EBS + IBS) to the MOOD platform in February 2024 (the approach is also generic, thus can be extended to other diseases)
—————————————-
Document prepared by Fanny Bouyer – GERDAL, Léa Zamuner – OGH, Timothée Dub – THL, Elena Arsevska – CIRAD, Pascal Poncelet – LIRMM, Francesca Dagostin – FEM, Maria Vincenti – ULB, Mathieu Roche – CIRAD, Pierrine Didier – VetSupAgro, sarah Houben – Avia-Gis