Updated 28/10/2022: v155 now includes Google reports up to the 14th of October 2022. At this time Google have indicated that they will no longer be releasing this data so we are not expecting to update these maps further. We have also now split the data into three excel spreadsheets for mapping into data for 2021, and for 2020 before and then after the 1st of October. This has been done because of the size of the spreadsheets in question. For the 3-day average data there are now two spreadsheets one for 2021 and one for 2020.
Please note datasets for 220422 and 240422 have significantly more missing data values than is routinely the case. Google has not provided any reason for this. As far as can be ascertained, the dataset appears to return to normal from the following week 290422.
Please note Google has now updated some categories to improve how they compute retail, recreation and other categories. The latest update will ensure consistency in the way that the data is being reported.
For our data this means that we are again mapping all categories, please use the latest data files to ensure consistency.
As of the 26th July Google has also released higher resolution data for a number of countries. We have improved the resolution of the maps for France, Italy, Spain, Sweden and Switzerland. Currently we are not plotting the improved data for other countries as the new admin areas are too small to be viewed on out two map extents. The data is available in the spreadsheets however for your own analysis.
We use the data from the CSV provided by Google and calculate the data using a mean of the last three days from each date. This differs slightly from Googles PDF reports that present data only from the single previous day. A spreadsheet of 3 day moving means for all days from February the 17th, the days are referenced by their Gregorian calendar, so February the 17th for instance is day 48.
Google has published a series of PDF files and now a CSV file presenting reports on national and subnational human mobility levels relative to a baseline data of late January 2020. The details and the PDF files can be found at https://www.google.com/covid19/mobility/.
The first set of data were released on April 2 2020 and have been revised weekly since then.
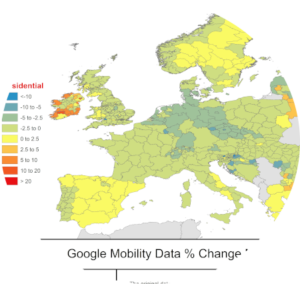
The authors have extracted the majority of these data into a series of excel spreadsheets and maps, currently accessible on figshare. The spreadsheet provides the data for % change in numbers of records each week at various types of location categories illustrated by: retail and recreation, grocery and pharmacy, parks and beaches, transit stations, workplaces and residential. Further details are in the notes worksheet. The maps (for EU & Global) display these data. We provide 600 dpi jpegs of the Global (“WD”) and European (“EU”) mapped values at the latest date available, for each of the mobility categories: retail and recreation (“retrec”) , grocery and pharmacy (“grocphar”) , parks (“parks”) , transit stations (“transit”), residential (“resid”) and workplaces (“work”). We also provide maps of the changes from the previous week (“ch”).
All data extracting and subsequent processing have been carried out by ERGO (Environmental Research Group Oxford) on behalf of the MOOD H2020 project. Data will be periodically updated. Additional maps can be obtained on request to the authors.


