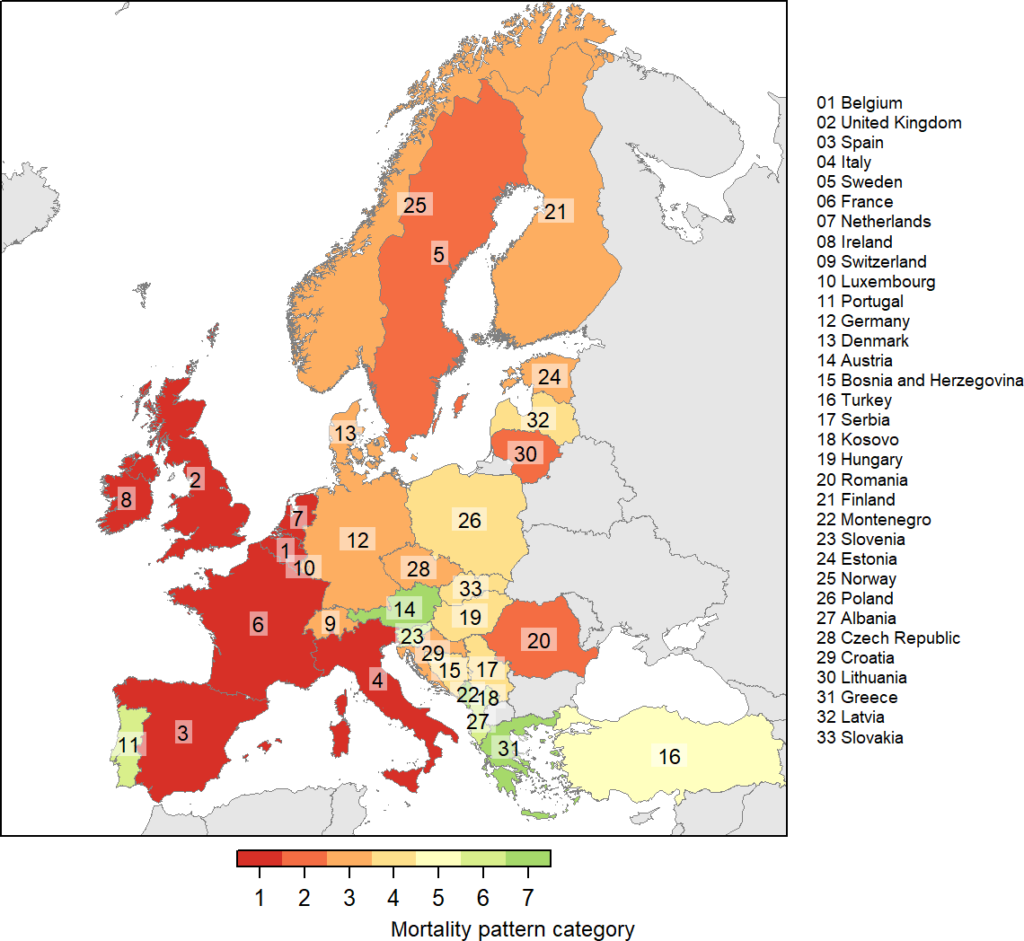
European countries categorized according to their COVID-19 mortality patterns combining cumulative mortality rate, time from the first death to the mortality peak, and various indicators of mortality persistence after this peak.The categories are ranked from 1 (the most severe with respect to COVID-19 mortality features) to the mildest. Ranking is based on the results of a principal components analysis of mortality features, using data available from ECDC on 23rd July 2020.
Visualizing COVID-19 mortality in Europe
Please access the latest report from the link at the bottom of this page…
This work is done in the frame of the Horizon 2020 MOOD project (2020-2023) funded by the European Commission.
Goal
To provide a near real-time visualization of COVID-19 related mortality in Europe, highlighting:the public-health consequences of COVID-19 transmission dynamic – in particular to help knowing whether an epidemic peak in daily mortality rate has been reached and starts decreasing,
the effect of the implementation of lockdown measures on daily mortality rate.
This website uses cookies to improve your experience. We'll assume you're ok with this, but you can opt-out if you wish. Cookie settingsACCEPT
Privacy & Cookies Policy
Privacy Overview
This website uses cookies to improve your experience while you navigate through the website. Out of these cookies, the cookies that are categorized as necessary are stored on your browser as they are essential for the working of basic functionalities of the website. We also use third-party cookies that help us analyze and understand how you use this website. These cookies will be stored in your browser only with your consent. You also have the option to opt-out of these cookies. But opting out of some of these cookies may have an effect on your browsing experience.
Necessary cookies are absolutely essential for the website to function properly. This category only includes cookies that ensures basic functionalities and security features of the website. These cookies do not store any personal information.
Any cookies that may not be particularly necessary for the website to function and is used specifically to collect user personal data via analytics, ads, other embedded contents are termed as non-necessary cookies. It is mandatory to procure user consent prior to running these cookies on your website.